Welcome back!
What's new in this week's release
- From now on, all Analytics widgets that display percentages will show two decimal places. A value like 25.6% will therefore now be displayed as 25.60%.
- The Analytics Table widget now also supports displaying the bounces by domain (e.g., hotmail.com, gmail.com) as percentages. This option was already available in the Pie Chart widget.
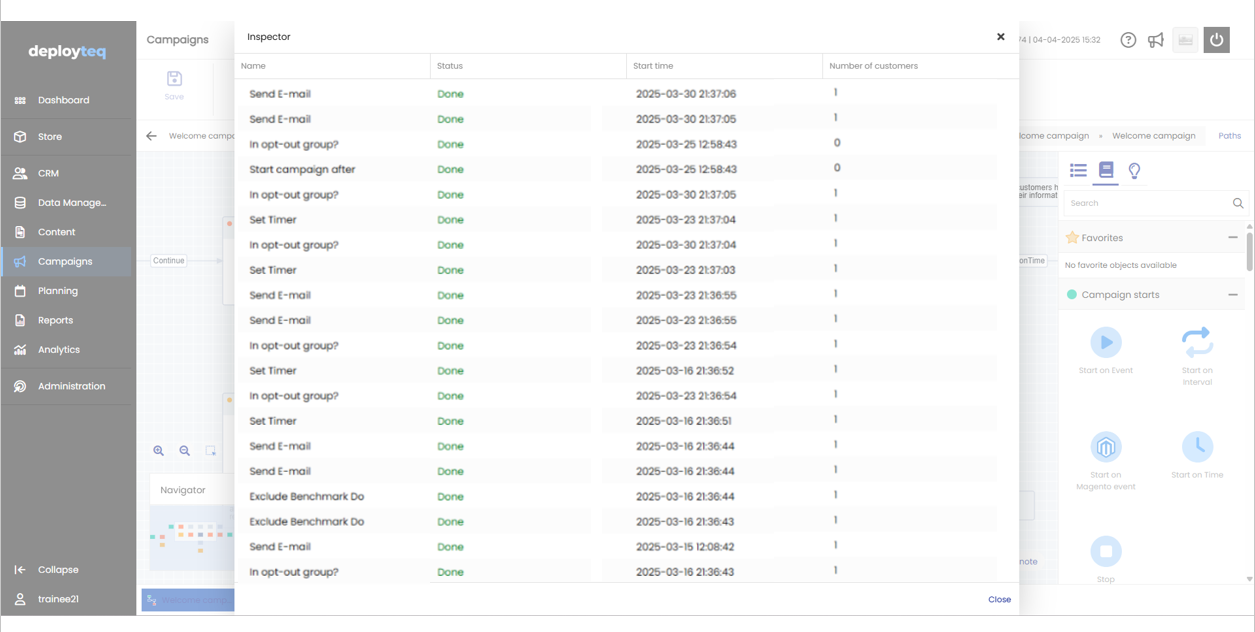
- The campaign event overview, which was previously only available under Reports in the old interface, is now available in an updated form within the Campaign Designer (in both the old and new themes) via the "Inspector" button.

- While the old functionality was limited to 15 events, the new overview allows you to view up to 100 events.
- In recent weeks, many changes and new features related to Push notifications and Push Topics have been included in the releases. The manual has been updated accordingly: all new fields and objects are now described and explained.
Quarterly release notes overview
- Curious about what has been released in the past 3 months? Click here to for the Quarterly Release Notes overview for Q1!
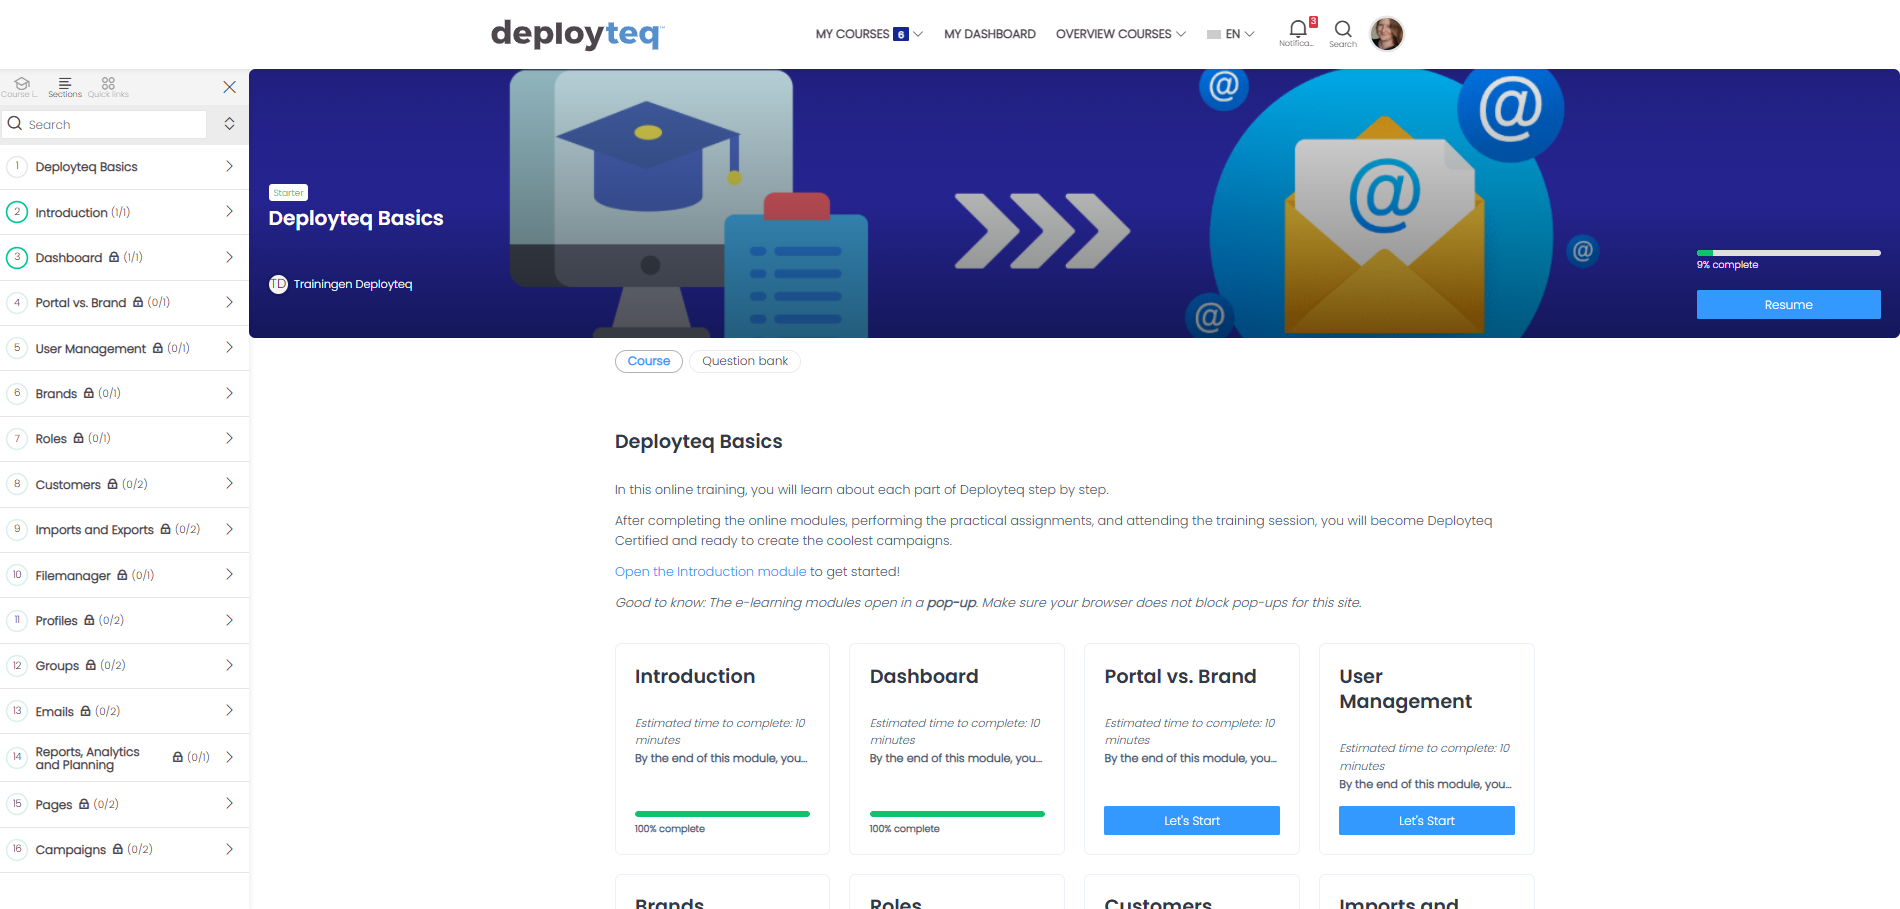
In the spotlight: a new form of training!
- In addition to our two-day Basic Training, we now offer a new way to learn the Deployteq basics. This blended format includes 15 short online e-learning modules in the Deployteq Academy, covering all key aspects, followed by a half-day training session. The online modules feature a mix of animations, reading materials, videos, exercises, downloads, and hands-on assignments in a Deployteq training environment. You can read more about it here!
We wish you a great week!