When you open Deployteq, you will first see your personal dashboard. It already contains some standard ‘widgets’. If you would like more, such as see the size of several groups, for example, or configure certain blogs as RSS feed, this is possible. We explain how to configure them below.
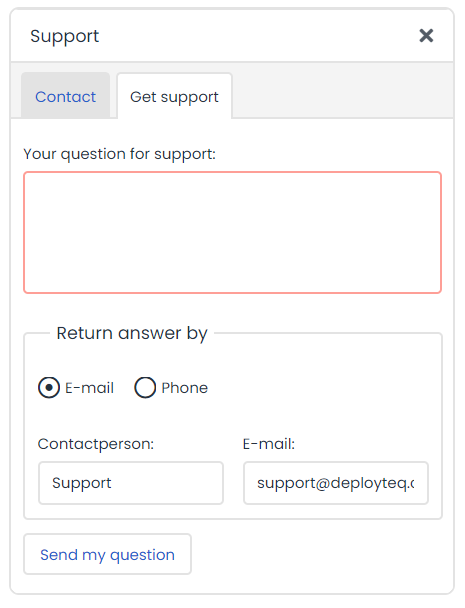
Your dashboard is displayed as soon as you log in. It contains information such as support details. It shows you two tabs: the contact details and the option to submit a ticket:
You can also add other widgets to your dashboard. Underneath the close button in the top right, you can see the word Widgets displayed vertically. Click on this to display the various widgets. Drag the widgets to the desired location to create a personal and clearly organized dashboard.
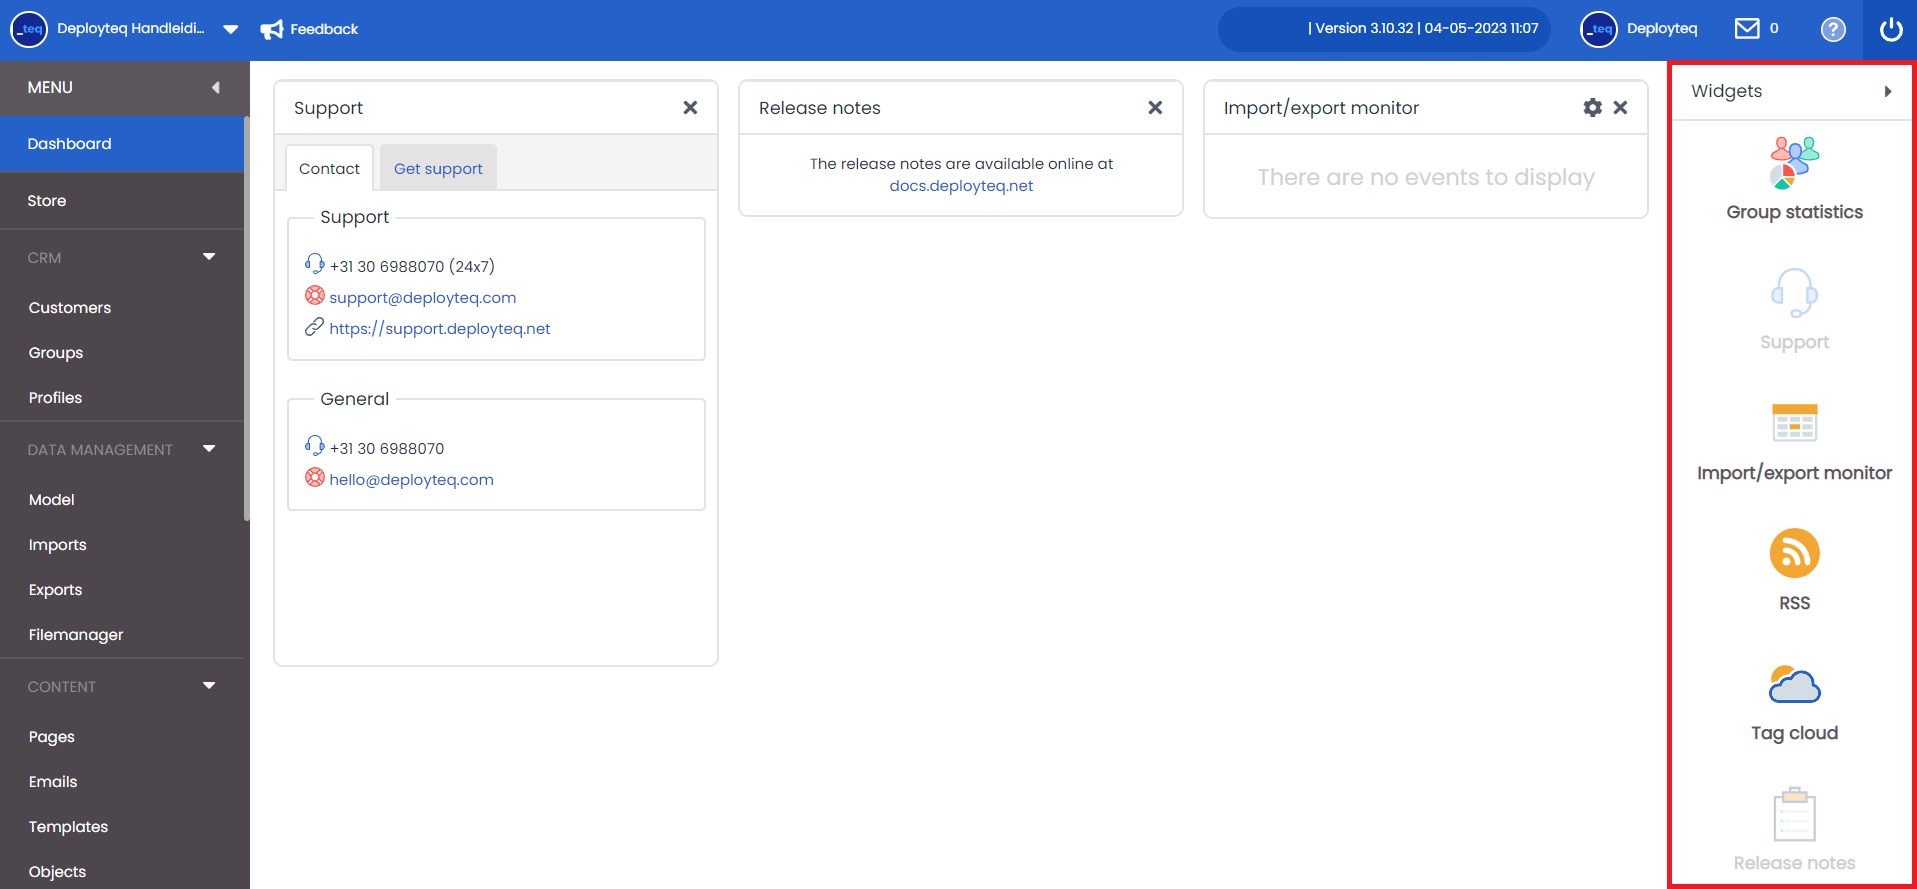
Deployteq provides the following widgets:
- Group statistics: an overview of the numbers in your chosen groups.
- Import/Export monitor: an overview of the most recently generated Imports or Exports.
- Tag Cloud: an overview of the most frequently clicked tags in your e-mails.
- RSS feed: a number of feeds are already configured but you can also add your own feeds here.
- Release Notes: displays the link to the Release Notes in this manual.
- Support: shows the contact details for the support department and offers the option to submit a support ticket. This is a default feature of your dashboard.